In the last section we introduced Moving Averages or Mas. We used a single MA in isolation and let it guide us into possible buying and selling opportunities. We used the 100SMA (100 Period Simple Moving Average) on a 4 hour GBP/USD chart – this is a relatively ‘slow’ MA. In this section, we will take our look at MA’s a little further and look at Moving Average Crosses using both a ‘fast’ and ‘slow’ MA:

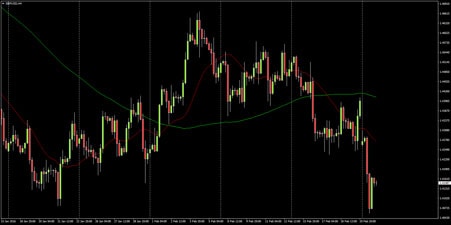
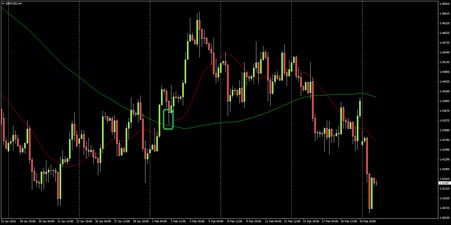
We have kept the ‘slow’ 100SMA from the previous section (green line) and added in a ‘fast’ MA: the 20SMA (red line). In the previous section, we looked at price’s relation to the 100SMA and used that to determine our buying/selling bias. Here we will go a little further and look at the relationship between the fast and slow MAs. Note that when the fast MA (red) crosses above the slow MA (green) on the 2nd of February, GBP/USD appreciates over 300 pips.

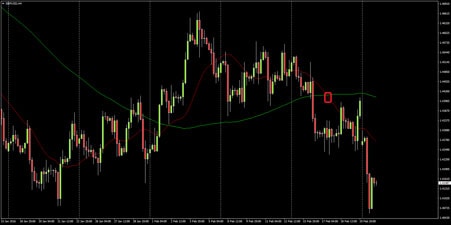
However, when the fast MA crosses back below the slow on the 17th of February, GBP/USD eventually declines around 240 pips (this move is probably still active):

“But it went up first!” you say?
True, but note after the Fast MA crossed below the slow MA, price never again breached the slow MA ie a trader with his stop above the 100SMA survived the noise and caught the move lower.
Note that this approach is a lot more systematic than the subjective selling highs/buying lows strategy in the previous section. Trading systematically takes the guess work out of Forex trading and tends to be less taxing mentally than pure discretionary trading.
Wondering where to exit the trade? A lot of Forex traders simply take a multiple of their stop loss for their profit target, but this might not be for you. In the next section we will discuss another type of indicator; the Oscillator. Oscillators can be very handy when determining whether or not an instrument is oversold/overbought and hence, when to exit.


